
Why your consumption profile matters
Solar electricity is worth most when you use it yourself, because it replaces power you would otherwise buy at your own unit rate. Exported power usually earns far less. In the shared worked example used across this site, on-site use is valued at an illustrative 24p per kWh and export at an illustrative 5p per kWh. Every unit you use rather than export is worth nearly five times as much.
So the question is not just "how much electricity do we use?" but "when do we use it?" Two sites with identical annual consumption can have very different solar cases. A cold store running around the clock uses solar output at almost any hour it is produced. An office that closes at weekends and shuts down in August will export more of its summer generation. Annual totals from bills cannot tell those two apart. Half-hourly data can.
What half-hourly data is
Half-hourly (HH) data records how much electricity your site used in each 30 minute period, 48 readings a day, usually for a year or more. It shows the shape of demand through the day, the difference between weekdays and weekends, and the swing between seasons. Matched against a solar generation model for the same periods, it shows how much of the output you would use and how much you would export.
How to get your half-hourly data
Most larger business sites already have it. Common sources:
- Your electricity supplier. Many suppliers provide HH data through an online portal or on request. Ask for at least 12 months in a spreadsheet format.
- Your meter operator or data collector. On HH metered supplies, the appointed data collector holds the readings. Your supplier can tell you who they are.
- Smart or advanced meters. Many smaller business sites have smart or AMR meters that record half-hourly consumption, even if they are not billed that way.
- Building management or sub-metering systems. Useful for understanding which parts of the site drive demand.
- An energy broker or consultant, if you use one, may already hold the data.
You may be asked to sign a letter of authority so the data can be released to someone acting for you. If you share data with the installer, it should be used only to assess your site.
Profile classes and what they tell you
The first two digits on the top line of your MPAN are the profile class, which indicates how the supply is settled.
| Profile class | What it means | Data available |
|---|---|---|
| 00 | Half-hourly metered and settled | Full HH data from the supplier or data collector |
| 03 | Non-domestic, single rate | Monthly or quarterly reads; HH may be available from a smart or AMR meter |
| 04 | Non-domestic, economy 7 or two rate | As above, with day and night split |
| 05 to 08 | Non-domestic maximum demand | These classes were moved to HH settlement under industry change P272 from 2017, so many now show 00 |
The industry is also moving all supplies to half-hourly settlement through the Market-wide Half-Hourly Settlement programme, so profile classes are becoming less important over time. If your bill shows 03 or 04, ask your supplier whether HH data is available from your meter.
What the analysis looks for
Baseload
Baseload is the demand that never goes away: refrigeration, servers, compressors, ventilation, lighting that stays on, process loads. It is the most valuable demand for solar because it is there whenever the panels are generating. A site with a high daytime baseload can usually take a larger system with high self-consumption.
Weekday and weekend patterns
Many businesses use much less electricity at weekends. In summer, a weekend can mean most of the generation is exported. The analysis quantifies this, and it often explains why the optimum system size is smaller than the roof could take, or why a battery or export-limited design is worth looking at.
Seasonal usage
Solar generation in the UK is several times higher in summer than in winter. Sites that use more power in summer, such as those with cooling loads, match well. Sites whose demand peaks in winter, such as those with electric heating, export more of their summer output. Schools are a classic case: high daytime use in term, very low in the summer holidays when generation peaks.
Peaks and capacity
The data also shows your maximum demand and how close you run to your agreed supply capacity. That matters for EV charging, battery sizing and the G99 application.
Self-consumption and payback
The shared illustrative example on this site is a 100 kWp system costing about £90,000 excluding VAT and generating about 90,000 kWh a year. With 80% used on site at 24p per kWh and 20% exported at 5p, the annual benefit is about £18,180 and simple payback is roughly 5 years before tax relief.
Here is how the same system changes with self-consumption, using the same illustrative prices:
| Share used on site | On-site saving | Export income | Total a year | Simple payback |
|---|---|---|---|---|
| 90% | £19,440 | £450 | £19,890 | about 4.5 years |
| 80% | £17,280 | £900 | £18,180 | about 5 years |
| 60% | £12,960 | £1,800 | £14,760 | about 6 years |
| 40% | £8,640 | £2,700 | £11,340 | about 8 years |
These figures are illustrative and exclude maintenance, degradation, price changes and tax relief. They show why the analysis matters: getting self-consumption right is as important as getting the price right. Our solar payback page goes further, and the guide on how much solar your business needs covers sizing in more depth.
The battery case
HH data is also what tells you whether a battery is worth considering. If the analysis shows regular midday surplus followed by high evening or early morning demand, storing the surplus can raise self-consumption. If export is capped by the DNO, a battery can absorb output that would otherwise be curtailed. If your site uses almost all its solar output already, a battery for solar alone may not pay. See battery storage for business.
If you do not have half-hourly data
The analysis can still be done using monthly bills, a description of your operating hours and typical profiles for similar sites. The results are less precise, so the proposal should state the assumptions clearly and err on the cautious side for self-consumption. If you can get HH data later, the model can be re-run.
How the free survey uses your data
We arrange a free survey with one MCS certified installer matched to the site. If you share HH data or bills, the installer uses them to size the system against your actual demand and to estimate self-consumption, savings and payback. Your details go to that one installer only, and there is no obligation to proceed. See what the survey includes or request a free survey.
Frequently asked questions
How much half-hourly data do I need for a solar assessment?
Twelve months is the usual minimum, because it captures the full seasonal cycle of both your demand and solar generation. Two years is better if your operations changed recently or one year was unusual. Less than a year can still be used, but the installer will need to make assumptions about the missing months, and the proposal should say so.
Where do I find my half-hourly electricity data?
Start with your supplier: many provide it through an online account or will send it on request. If your supply is half-hourly metered, the data collector also holds it, and your supplier can tell you who that is. Sites with smart or AMR meters can often get HH data even if they are billed on monthly reads. An energy broker may already hold it.
What is a good self-consumption rate for commercial solar?
There is no single right figure, because it depends on the trade-off between system size and how much you export. Sites with steady daytime demand often achieve high self-consumption with a well sized system. Making the system larger usually lowers the percentage used on site but may still add value. The analysis should show the savings and payback at several sizes so you can choose.
Should I size solar to my roof or to my demand?
Usually to demand, with the roof as the upper limit. Filling the roof can make sense if export income is worthwhile, you expect demand to grow (for example from EV charging or electrified heating), or a battery is planned. If much of the extra output would be exported at a low rate, a smaller system may give a faster payback. HH analysis shows where the balance lies.
Is it safe to share my energy data with an installer?
You should only share it with someone assessing your site, and it should be used for that purpose. Through this site, your details go to one MCS certified installer matched to your site, not to a list. If you prefer, you can remove anything you consider sensitive before sending. See our privacy page for how we handle enquiry information.
Related pages
- Feasibility studyWhat a solar feasibility study covers, desktop versus on-site assessment, and the outputs a decision maker needs: size, yield, savings, payback, grid and risks.
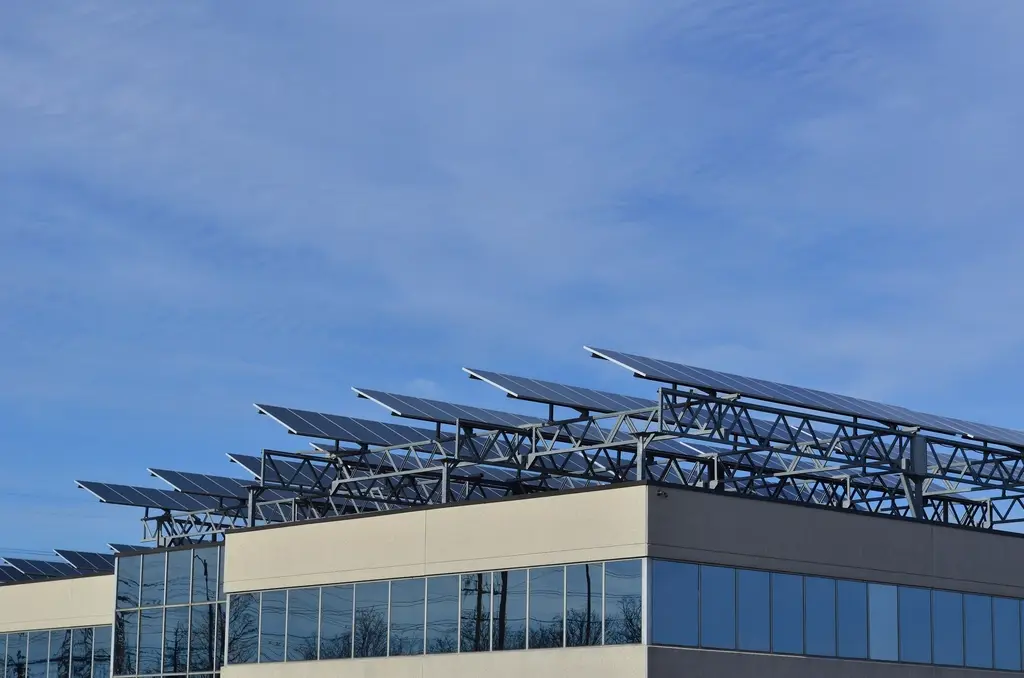 Battery storageWhen a commercial battery pays: storing surplus solar, time of use tariffs, peak shaving, sizing from half-hourly data, illustrative costs, safety and siting.
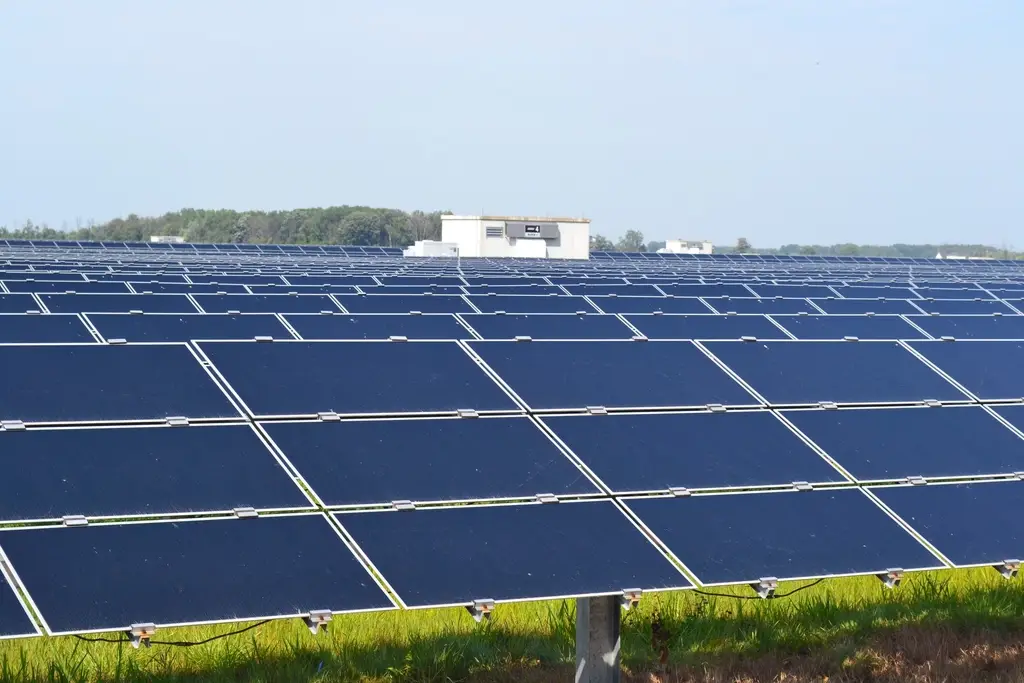 Solar paybackA worked payback example for a 100 kWp system, the factors that move the result most, the effect of tax relief, and a calculator to try your own figures.
- Sizing your systemHow to size commercial solar from consumption data, roof area and grid limits, with typical rules of thumb, a worked illustrative example and notes on batteries and future loads.
- Food and drinkRefrigeration and process cooling give food and drink sites a strong match with solar. The survey pays close attention to hygiene zones, insulated panel roofs and fire risk.
- What the survey includesThe full list of what is checked: energy use, roof, structure, grid, costs and finance.