
Solar payback calculator
IllustrativeChange the figures to match your site. The starting values are the illustrative 100 kWp example on this page. The result is a simple estimate before tax relief, maintenance and panel degradation, not a quote: the survey models your real roof and usage.
- Installed cost
- £90,000
- Generation per year
- 90,000 kWh
- Bill savings per year
- £17,280
- Export income per year
- £900
- Total benefit per year
- £18,180
- Simple payback
- 5.0 years
How the calculator works
The calculator above uses five simple steps. Nothing is hidden:
| Step | Sum |
|---|---|
| Installed cost | System size (kWp) x cost per kWp |
| Generation per year | System size x annual generation per kWp |
| Bill savings | Generation x share used on site x your unit rate |
| Export income | Generation x share exported x export rate |
| Simple payback | Installed cost / (bill savings + export income) |
It is a first look, not a quote. It shows whether the numbers are worth a survey, and which assumption matters most for your site.
The assumptions, and where they come from
Generation per kWp
We modelled one kilowatt peak of panels in 11 UK places with the European Commission's PVGIS tool (version 5.3, SARAH3 radiation data, 14% system losses) on 3 November 2026. Two layouts are shown: panels facing south at 30 degrees, typical of a pitched or framed roof, and an east-west layout at 10 degrees, common on flat roofs.
Annual generation per kWp, PVGIS 5.3, modelled 3 November 2026
| Place | South facing, 30 degrees | East-west, 10 degrees |
|---|---|---|
| Plymouth | 1,113 kWh | 931 kWh |
| Cardiff | 1,034 kWh | 865 kWh |
| Bristol | 1,015 kWh | 849 kWh |
| London | 1,010 kWh | 840 kWh |
| Birmingham | 960 kWh | 800 kWh |
| Leeds | 942 kWh | 778 kWh |
| Newcastle | 937 kWh | 764 kWh |
| Belfast | 910 kWh | 756 kWh |
| Aberdeen | 883 kWh | 715 kWh |
| Manchester | 880 kWh | 741 kWh |
| Glasgow | 845 kWh | 707 kWh |
The calculator starts at 900 kWh per kWp, inside that range. An east-west layout makes less per kWp but usually fits more panels on the same flat roof, and spreads generation across the working day. Shading, panel choice and the exact tilt move the real figure; the survey models your roof.
Your electricity unit rate
Use the unit rate on your own bill: it is the price solar replaces. For reference, the Department for Energy Security and Net Zero publishes what non-domestic customers pay, by size of user, including the Climate Change Levy and excluding VAT.
Business electricity prices, April to June 2026 (provisional), DESNZ Quarterly Energy Prices table 3.4.2, published 29 September 2026
| Size of user | Yearly use | Pence per kWh |
|---|---|---|
| Very small | Up to 20 MWh | 38.4p |
| Small | 20 to 499 MWh | 28.6p |
| Small/medium | 500 to 1,999 MWh | 27.7p |
| Medium | 2,000 to 19,999 MWh | 25.2p |
| Large | 20,000 to 69,999 MWh | 24.4p |
| Average | All non-domestic users | 24.5p |
Source: DESNZ, gas and electricity prices in the non-domestic sector. The calculator starts at 24p, close to the published average. Our guide to business electricity prices explains what makes up the rate.
Cost per kWp
The only government series of solar costs covers systems up to 50 kW. In the year to March 2026, the median cost of a 10 to 50 kW installation registered with MCS was £1,204 per kW of installed capacity (mean £1,267), and £1,167 per kW for non-domestic installations of that size on average. These figures include VAT where it applied (DESNZ solar PV cost data, published 28 May 2026, total installed capacity basis).
There is no published government figure for larger rooftop systems. The starting value of £900 per kWp is our illustrative figure for a 100 kWp roof, not a published price: larger systems usually cost less per kWp, while scaffolding, roof repairs, asbestos, structural work and grid upgrades add to it. Replace it with a quote, or with the cost range on our commercial solar cost page, and remember that a VAT registered business normally recovers the VAT.
Share used on site
The starting value of 80% suits a building that is busy on weekdays and uses power all day, such as a factory or a chilled warehouse. A site closed at weekends, or with most of its use at night, may use half or less. Half-hourly meter data shows the real figure; see energy data analysis.
Export rate
Exported power earns an export tariff, set by the supplier you sell to. Rates and terms vary, so there is no single national figure. The calculator starts at an illustrative 5p per kWh. Our Smart Export Guarantee page explains how export payments work.
Worked examples
The same sums, changing one thing at a time. All are illustrative.
| Example | Size | Cost | Generation | Used on site | Savings and export a year | Simple payback |
|---|---|---|---|---|---|---|
| Starting values | 100 kWp | £90,000 | 90,000 kWh | 80% at 24p | £18,180 | 5.0 years |
| Closed at weekends | 100 kWp | £90,000 | 90,000 kWh | 50% at 24p | £13,050 | 6.9 years |
| East-west flat roof, Manchester | 100 kWp | £90,000 | 74,100 kWh | 80% at 24p | £14,968 | 6.0 years |
| South facing, London | 100 kWp | £90,000 | 101,000 kWh | 80% at 24p | £20,402 | 4.4 years |
| Smaller site at the DESNZ median cost | 30 kWp | £36,120 | 27,000 kWh | 70% at 28.6p | £5,810 | 6.2 years |
The biggest swings usually come from the share used on site and the unit rate, not the weather.
What the calculator leaves out
A simple payback is useful for a first look, but it leaves out things your board will ask about:
- Tax relief. Most businesses that buy a system can claim capital allowances, which shortens the payback. See capital allowances and check with your accountant.
- Panel ageing. Output falls slowly over the years. See panel lifespan.
- Maintenance and the inverter. Inverters are often replaced once in a system's life. See maintenance.
- Price changes. The calculator holds your unit rate flat. If prices rise, savings rise; if they fall, savings fall.
- Finance. Loans, leases and power purchase agreements change the cash flow. See finance options.
- Grid limits. If the network operator caps export, some generation may be turned down. See G100 export limitation.
- Batteries. Storage can raise the share used on site at extra cost. See battery storage.
How big a system?
Divide your yearly electricity use by the generation per kWp for your area to find the system that would make as much as you use in a year. Most businesses install less than that, because much of the summer output would be exported. Our guides to how much solar your business needs and system sizes go further.
Get your real numbers
The survey replaces every assumption on this page with a figure for your site: your roof's layout and shading, your half-hourly data, a quoted cost and your grid position. It is free and carries no obligation. See what you qualify for and get the real numbers.
Frequently asked questions
How accurate is a commercial solar calculator?
Only as accurate as its assumptions. The generation figures here come from PVGIS and are long-run averages, so a single year can be higher or lower. The share of power you use on site and your unit rate usually matter more than the weather. A survey uses your half-hourly data and a quoted cost to give a figure for your site.
How much electricity does 1 kWp of solar generate in the UK?
Our PVGIS modelling on 3 November 2026 gave about 845 to 1,113 kWh a year for panels facing south at 30 degrees, from Glasgow to Plymouth, and about 707 to 931 kWh for a flat-roof east-west layout. Shading, tilt and panel choice change the figure for a particular roof.
What payback period is typical for commercial solar?
With the illustrative starting values on this page, about 5 years before tax relief. Sites that use less of the output, pay a lower unit rate or need roof or grid work take longer. The worked examples show how much each assumption moves the result.
What electricity price should I use?
The unit rate on your own bill, because that is what each kWh of solar replaces when you use it on site. For reference, DESNZ's provisional figure for April to June 2026 was 24.5p per kWh for the average non-domestic user, including the Climate Change Levy and excluding VAT, and higher for smaller users.
Does the calculator include tax relief?
No. It shows a simple payback before tax. Most businesses that buy a system can claim capital allowances on it, which shortens the payback in practice. Confirm the treatment with your accountant.
Related pages
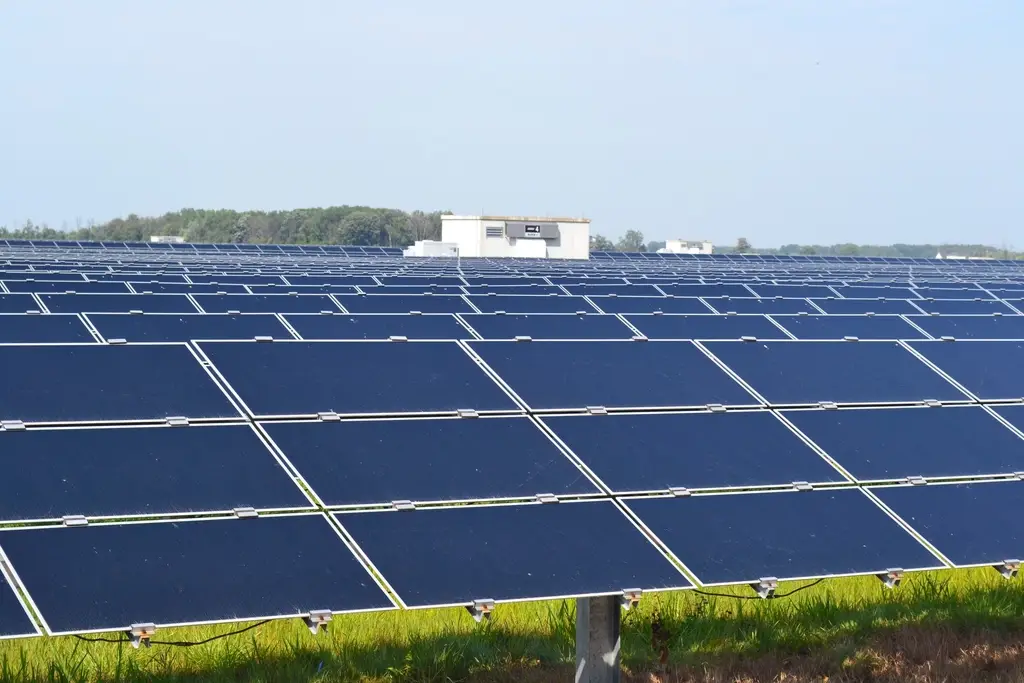 Solar paybackA worked payback example for a 100 kWp system, the factors that move the result most, the effect of tax relief, and a calculator to try your own figures.
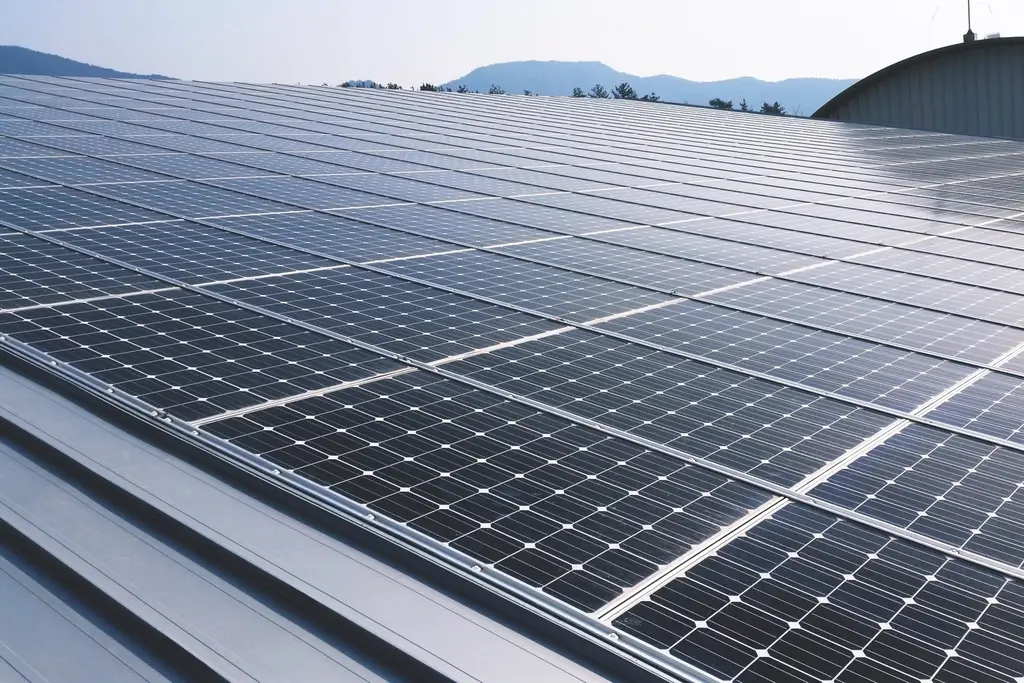 Commercial solar costIllustrative prices per kWp by system size, extra costs, running costs, VAT and tax.
- Sizing your systemHow to size commercial solar from consumption data, roof area and grid limits, with typical rules of thumb, a worked illustrative example and notes on batteries and future loads.
- Energy data analysisHow half-hourly consumption data shapes solar sizing and payback: getting the data, profile classes, baseload, weekend and seasonal use, self-consumption and batteries.
 Capital allowancesHow solar panels are treated for capital allowances: the special rate pool, the Annual Investment Allowance, the 50% first year allowance for companies, and illustrative examples.